The quickest website speed test is Google's PageSpeed Insights: paste your address, pick Mobile, and read the results. For a small service business, the big score at the top matters least. What counts is whether the first screen shows up fast on a phone over a weak signal, and whether anything on it jumps around or freezes when someone taps. On a site with five or six pages, the fixes are usually few: the photos, the hosting and any extra scripts.
How to run a website speed test in 3 minutes
You need a computer, your web address and nothing else. PageSpeed Insights is free and doesn't ask for a login.
- Go to PageSpeed Insights, paste your homepage address, including https://, and click Analyze.
- When the report loads, make sure the Mobile tab is selected. Your customers find you on their phones, so start there.
- Look at the top section, the one about your real users (field data). It either shows three bars with numbers or says there isn't enough data.
- Scroll down to the Performance score and the five lab numbers under it.
- Scroll further to the list of problems it found. Write down anything that mentions images, server response time, or scripts from other companies.
- Run it again on your main service page, the one your Google Business Profile links to if it isn't the homepage.
- Run the homepage one more time. If the score moves a few points, that's normal.
That gives you two kinds of numbers. They answer different questions, so read them separately.
Field data vs. lab data: which PageSpeed Insights numbers count
PageSpeed Insights puts two reports on one page, and most confusion comes from mixing them up.
Field data sits at the top. It comes from real people who visited your pages in Chrome over the previous 28 days. Google describes it as the true, real-world experience, with fewer metrics. If your page doesn't have enough visits, the tool falls back to data for your whole website. If the whole site doesn't have enough either, it shows no real-user data at all.
Lab data sits below, under the Performance score. It comes from Lighthouse, a testing tool that loads your page once in a controlled setup. That setup is harsh on purpose. Lighthouse slows the connection to what it calls Slow 4G, with 150 milliseconds of delay and 1.6 Mbps download speed. It also runs the page four times slower than your computer would. Google says lab data is useful for debugging. In plain terms, it's a stress test for finding problems, and it can differ a lot from what your customers saw.
| Field data (top of the report) | Lab data (Performance score) | |
|---|---|---|
| Where it comes from | Real Chrome visitors, last 28 days | One simulated load on a throttled phone |
| What it's good for | Knowing what customers actually get | Finding what to fix |
| Main numbers | LCP, INP, CLS, plus FCP and TTFB | 0 to 100 score, LCP, CLS, Total Blocking Time and two more |
| Small sites | Often empty | Always there |
| Changes between runs | Slowly, as the 28 days roll | Can move a few points each run |
Search Console's Core Web Vitals report uses the same real-visitor source. It shows "No data available" when there isn't enough data for your site.
Why a 5-page service site often has no field data
Chrome's real-user dataset only includes pages and sites with enough visitors, and Google doesn't publish the cutoff. A page also has to be public: one that returns an error or is marked noindex is left out.
Most speed guides are written for online stores and busy blogs, and they assume you have those numbers. A plumber or roofer in one metro area often doesn't. If the top of your report is empty, there's nothing to fix there. Google simply has little real-visitor speed data on your site.
It also changes how you use the tool. With no field data, the lab report is your only measurement. Treat it as a list of suspects, not a grade. And skip the advice to set up paid monitoring. For a site this size, a monthly PageSpeed Insights run and a look on your own phone cover it.
Core Web Vitals thresholds, checked September 2026
Core Web Vitals are the three real-visitor measurements Google uses to judge page experience. Interaction to Next Paint replaced First Input Delay as a Core Web Vital on March 12, 2024. Any guide that still grades you on FID is out of date. Google measures each one at the 75th percentile of page loads, split into mobile and desktop. In practice, three out of four visits have to be at least that good.
| Metric | What it means for a customer | Good | Needs improvement | Poor |
|---|---|---|---|---|
| Largest Contentful Paint (LCP) | How long until the main photo or headline shows | 2.5 s or less | Up to 4 s | Over 4 s |
| Interaction to Next Paint (INP) | How fast the page reacts when they tap the menu or a button | 200 ms or less | Up to 500 ms | Over 500 ms |
| Cumulative Layout Shift (CLS) | How much the page jumps while loading | 0.1 or less | Up to 0.25 | Over 0.25 |
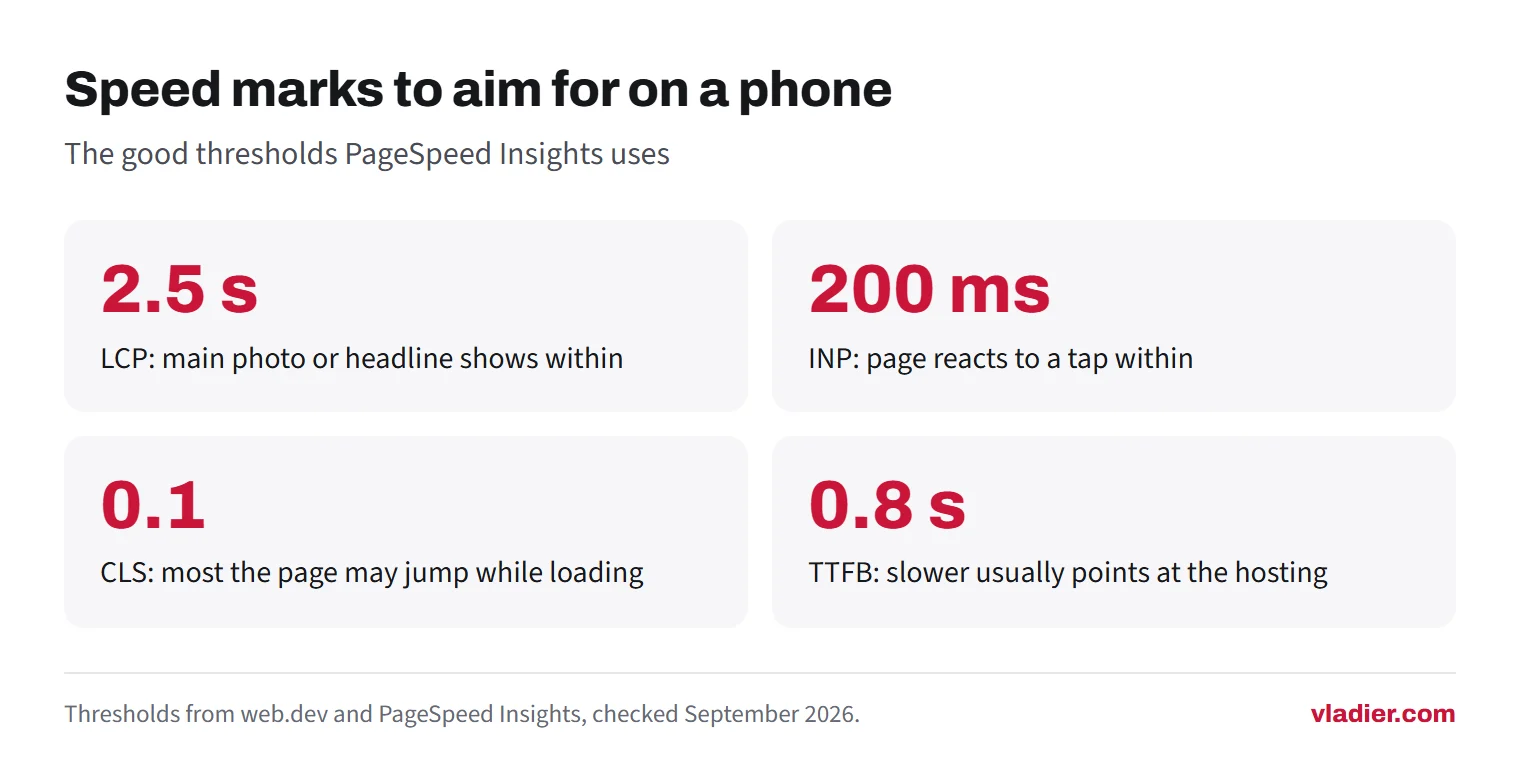
A page passes the Core Web Vitals assessment when all three are in the good range at the 75th percentile. PageSpeed Insights also shows First Contentful Paint and Time to First Byte. The good marks there are 1.8 seconds and 0.8 seconds. A slow Time to First Byte usually points at the hosting.
The Performance score is a different thing. It's a lab score: 90 or above is good, 50 to 89 needs improvement, under 50 is poor. Lighthouse builds it from five lab numbers, and Total Blocking Time carries the most weight at 30%.
What we got testing our own sample sites
We don't test other companies' websites, so here are our own. On September 17, 2026 we tested our plumbing, HVAC and electrical sample pages with Lighthouse 13.4.1, using its standard mobile settings. That's the engine behind the lab half of PageSpeed Insights. We ran it from our own computer because the PageSpeed Insights API wasn't taking requests from us that day. Treat these as lab numbers only.
Each page weighed about 70 KB in total and made 4 requests. The Performance scores were 91, 90 and 91. Total Blocking Time was 0 ms and layout shift was 0 on all three. The server answered in 120 ms.
Largest Contentful Paint came in at 2.8 seconds, above the 2.5-second mark. The cause was the fonts. About 60 KB of the 70 were two web font files. Lighthouse flagged the stylesheet that loads them as render-blocking, meaning the browser waits for it before drawing the page, and estimated up to 1.7 seconds could be saved.
Two lessons for your own report. First, even a tiny page can miss a lab target under Lighthouse's slow-connection test, so a number just over the line isn't an emergency. Second, the problem list is more useful than the score. It told us exactly which file to look at.
What to fix first on a small service website
Generic speed checklists list thirty items as if they were equal. On a site with a handful of pages, a short list does most of the work. Here it is by how much it usually helps.
- Oversized photos. A job photo straight from a phone camera can be several megabytes. Resize it to the width it's shown at and save it as WebP or a compressed JPEG. Don't lazy-load the big photo at the top of the page. Google's guidance says never to lazy-load the image that counts as your LCP, and to mark it with fetchpriority="high". Photos further down the page can load lazily.
- Slow hosting. If Time to First Byte is over 0.8 seconds, the page is late before anything else happens. Nothing can happen in the browser until the server sends its first byte. Cheap shared hosting and a site with no caching are the usual causes. Our hosting cost guide covers what a fair price gets you.
- Other companies' scripts. Chat bubbles, review widgets, booking pop-ups, several tracking pixels and embedded videos all run code on your page. They push up Total Blocking Time in the lab and hurt INP for real visitors. Remove any you don't use. For a video or map, show a picture that loads the real thing only when tapped.
- Page builder and plugin weight. A WordPress site with 30 plugins, or a builder theme with sliders and animations, ships code for features you never turned on. Deleting unused plugins and swapping the slider for one photo often beats any tuning.
- Fonts. Our own samples showed it: two web fonts took most of the page weight. Use one or two font weights, or system fonts, and make sure text shows while the font loads.
- Layout shift. Give photos a set width and height, and don't let a banner or cookie bar push the page down after it loads. That keeps CLS under 0.1.
After each fix, run PageSpeed Insights again on the same page and compare the lab numbers. Then check the site on your own phone over cellular data. If the problem list is down to small items, like a few KB of unused CSS, stop there.
How much speed matters for ranking
Some, but less than most speed guides imply. Google says good Core Web Vitals line up with what its core ranking systems reward. It also says good results in these reports don't guarantee top rankings. Google still shows the most relevant page, even when its page experience is poor. On perfect scores, Google's advice is direct: chasing one just for SEO may not be the best use of your time.
For a local service business, speed matters more for the call than for the ranking. Someone with a leaking water heater taps the first result, and a blank white screen for four seconds sends them back to the next one. A good target is simple: the first screen and the phone number show up fast on a phone. If the page is fast but the number is hard to find, read our guide on the website call button next.
What to do today: run PageSpeed Insights on your homepage, Mobile tab, and write down whether the top section shows real data. Then fix the first item on the list above that shows up in your report. If someone else manages your site, send them the report link and ask for the photos and server response time first. Our plans include hosting and edits, so on a Vladier site that request goes to us.
Frequently asked questions
What is a good PageSpeed Insights score?
Why does my PageSpeed Insights score change every time I run it?
Why does PageSpeed Insights say there's no data for my site?
Is FID still a Core Web Vital?
Why is my site slow on phones but fast on my computer?
Sources we checked (11)
- PageSpeed Insights: About PageSpeed Insights (field data, lab data, thresholds, score ranges)
- web.dev: Web Vitals (thresholds and the 75th percentile)
- web.dev Blog: Interaction to Next Paint becomes a Core Web Vital on March 12 (2024)
- Google Search Central: Understanding page experience in Google Search results
- Google Search Central: Understanding Core Web Vitals and Google search results
- Chrome for Developers: Lighthouse performance scoring (weights and score variability)
- Lighthouse on GitHub: Network throttling and CPU throttling (Slow 4G, 4x CPU)
- Chrome for Developers: CrUX methodology (eligibility of pages and origins)
- Search Console Help: Core Web Vitals report
- web.dev: Optimize Largest Contentful Paint
- PageSpeed Insights (the free test tool)
Want to see a new site before you decide anything?
We'll build your website for free and send you a private link. If you like it, plans start at $99/month. If not, you owe nothing.
Build my free website